Reports
The reporting pages in Taxi CRM 2026 and how the booking/revenue report is built — filter panel, DataTable columns, and toolbar controls.
Taxi CRM 2026 ships a family of report pages that all follow the same recipe: a collapsible filter panel, a server-fed DataTable, and a toolbar of table controls. Once you understand one report you understand them all — only the columns, the data endpoint and the per-column filters change.
The shared pattern is:
- A card panel (often hidden until you open it) holds the filter inputs.
- A second card panel wraps a
table.dt-wrapperDataTable bound to a report endpoint viaAPI_CONFIG. - The page script (under
assets/js/pages/reports/) defines the columns, renderers and filters, then callsapp.datatables.initToolbar(...)to wire up the toolbar.
Every report reuses the kit's DataTable helpers, so the filtering, paging, search, serial-numbering and expandable-row mechanics are documented once in Tables. This page focuses on the bookingReport page in detail, then indexes where every other report is documented.
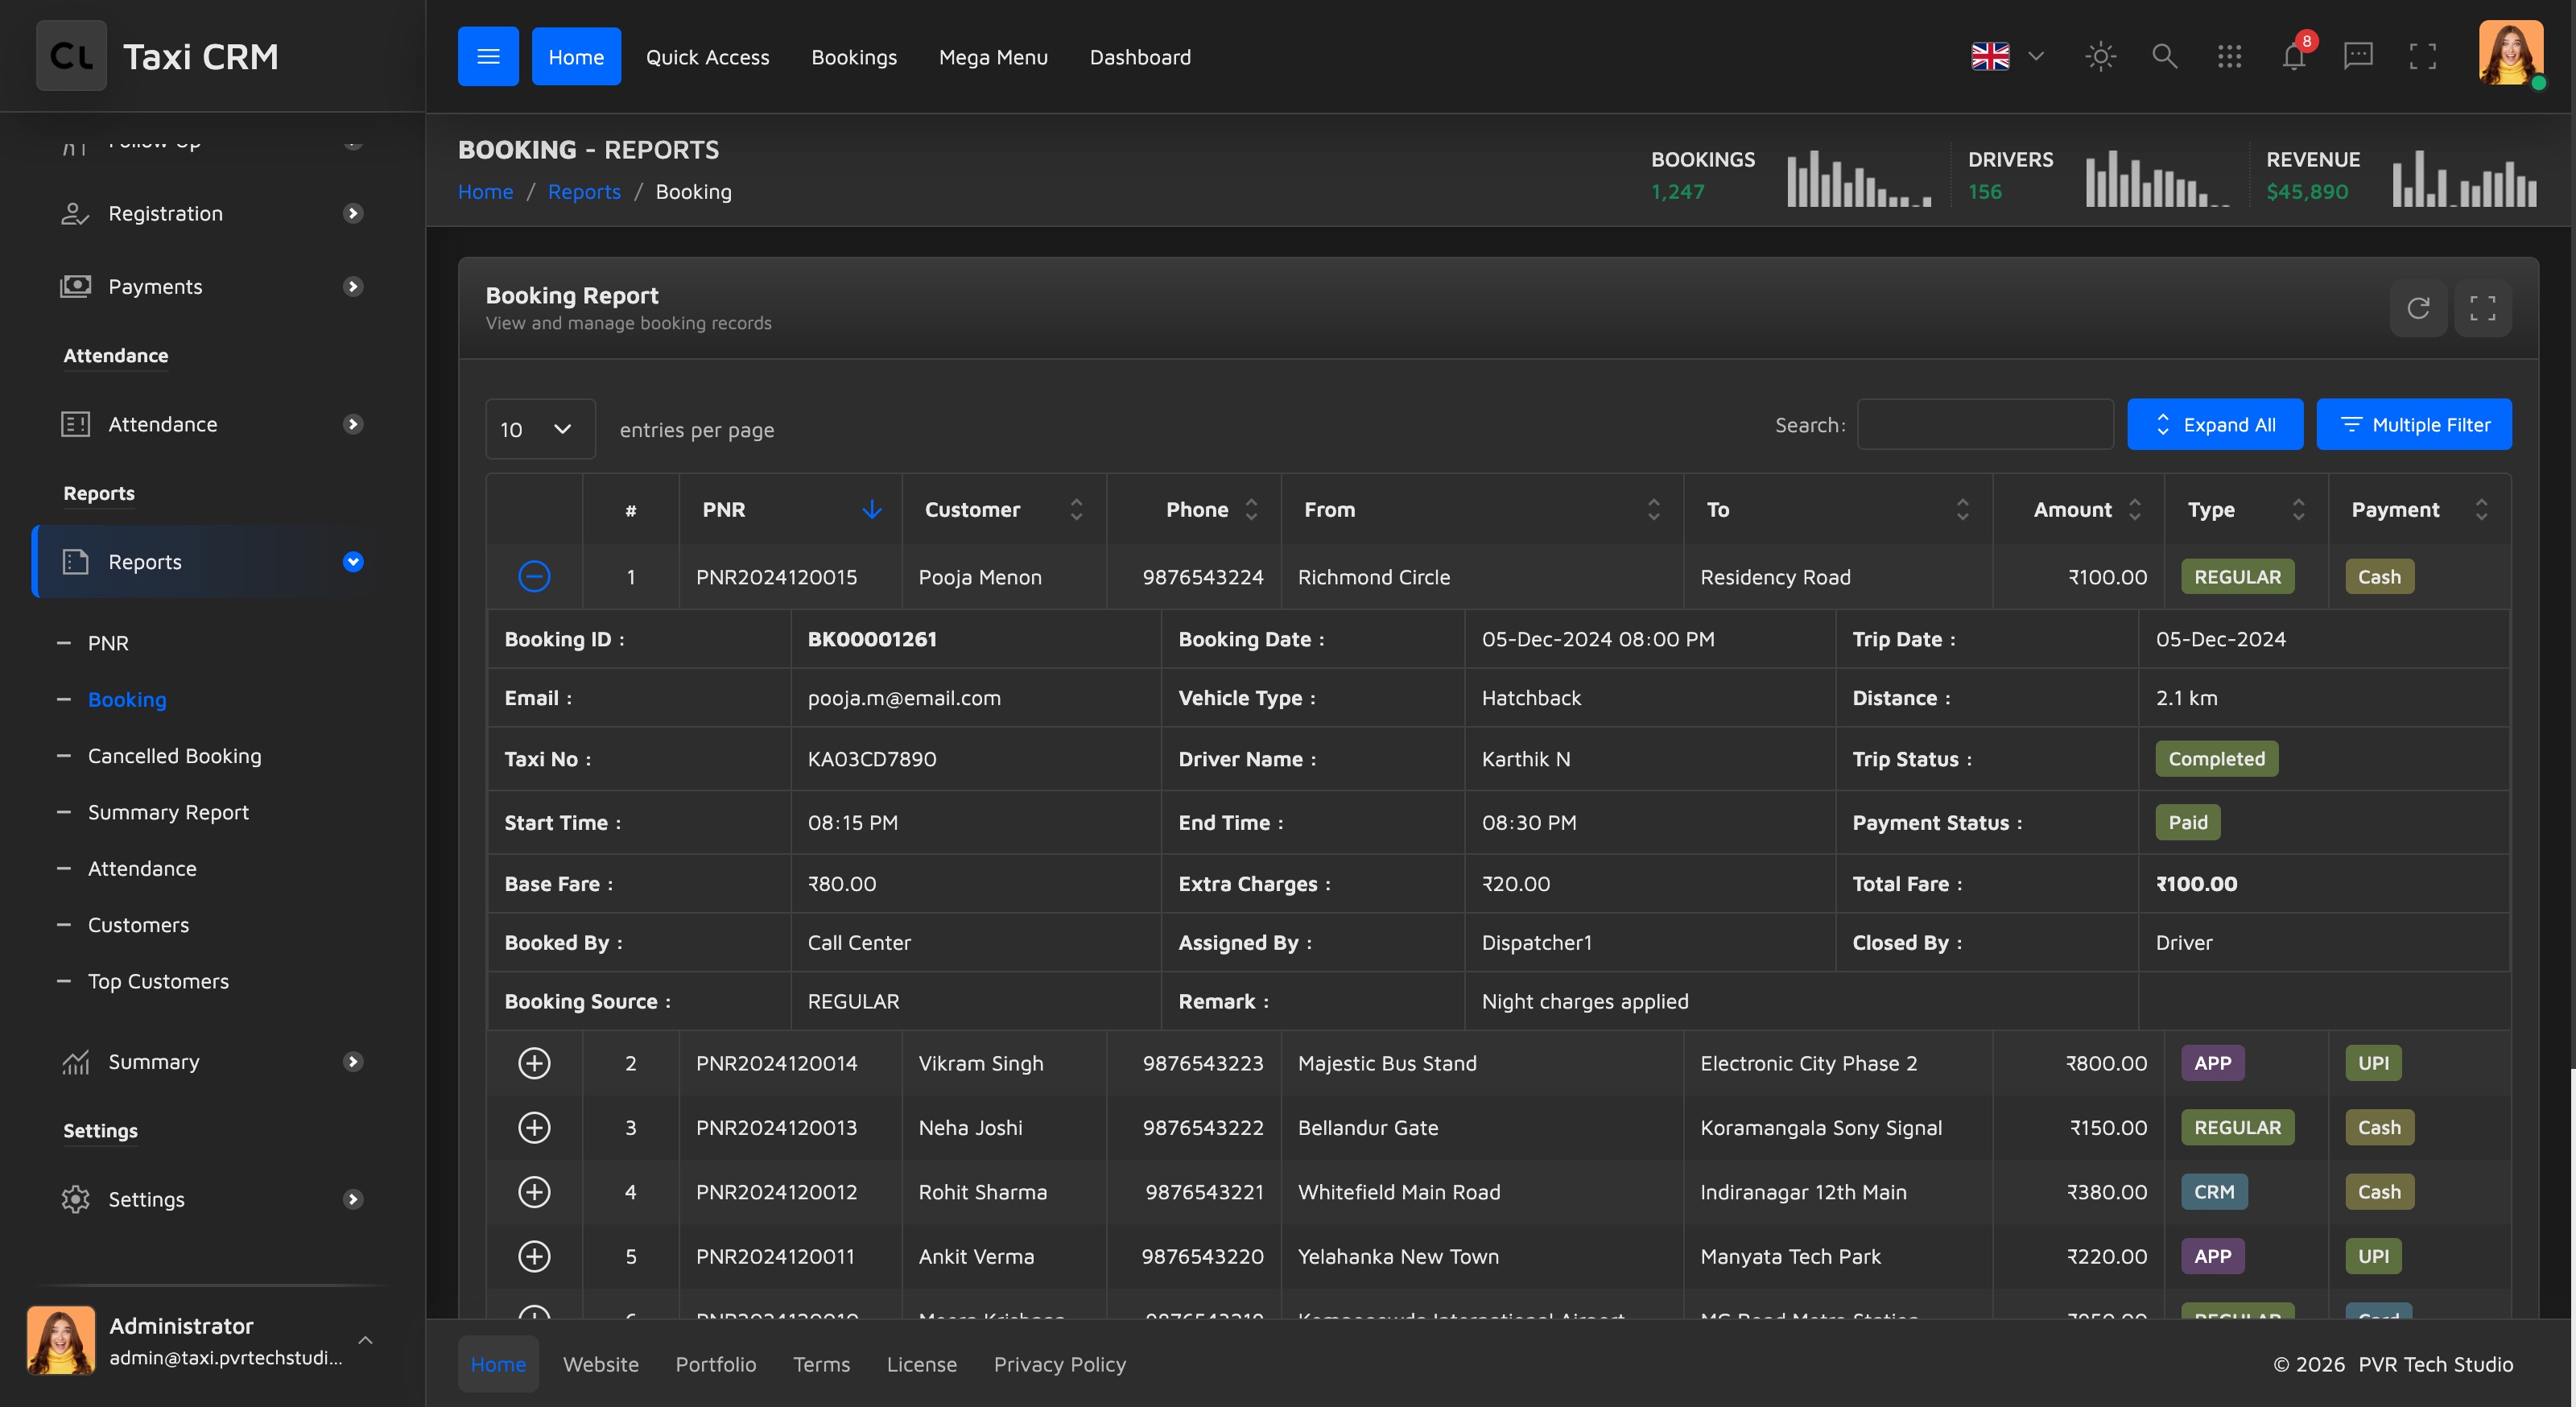
bookingReport
bookingReport.html is the flagship report — the booking/revenue ledger. Delivered files:
- Page:
bookingReport.html - Script:
assets/js/pages/reports/bookingReport.js - Labels:
assets/locales/en/bookingReport.json
Layout
The page is two stacked panels inside the standard pageWrapper:
- Booking Search — a card panel that is hidden by default
(
#show_multiple_filter_divcarriesdisplay: none;). Its body is an empty.row#append_colthat the script fills with filter fields at runtime. It is revealed by the toolbar's filter button. - Booking Report — the main card panel holding the DataTable
(
table#initDataTableinside.table-responsive.dt-wrapper).
Because the filter fields are generated from the table headers, you never hand-author them — see Filters below.
Columns
The visible table header declares ten columns; the script (getColumns()) binds each to a
field in the JSON response. The first two columns are UI affordances rather than data.
| # | Header | Data field | Notes |
|---|---|---|---|
| 1 | (none) | — | Expand control (details-control); click to open the detail row |
| 2 | # | — | Running serial number, re-numbered on every draw |
| 3 | PNR | pnr | Default sort column (descending) |
| 4 | Customer | customerName | |
| 5 | Phone | mobile | |
| 6 | From | pickup | |
| 7 | To | drop | |
| 8 | Amount | fare | Right-aligned; rendered as INR currency via Intl.NumberFormat('en-IN') |
| 9 | Type | bookingSource | Coloured badge (CRM / REGULAR / APP) |
| 10 | Payment | paymentMode | Coloured badge (UPI / Cash / Card) |
The Type and Payment cells are rendered as badges from the kit's pale palette
(badge-blue, badge-green, badge-purple, badge-yellow, badge-teal). The badge classes
live in 24-badges.less; the mapping is in the script's renderers object.
Expandable detail row
The leading details-control column makes each row expandable. Clicking it renders a detail
table (built by formatExpandedRow) with fields that are not shown in the main grid:
Booking ID, Booking / Trip dates, Email, Vehicle Type, Distance, Taxi No, Driver Name, Trip
Status, Start / End time, fare breakdown (Base Fare, Extra Charges, Total Fare), the
Booked / Assigned / Closed-by audit trail, Booking Source and Remark. Trip Status and Payment
Status inside the detail row are also badge-coloured.
The first row is auto-expanded after data loads, so the report opens showing a sample
detail. Expand/collapse plumbing comes from app.datatables.initExpandEvents(...).
Filters
There is no hand-written filter form. On initComplete the page calls
app.datatables.initToolbar(...) with filterButton: true, which scans the table headers and
auto-builds the filter panel:
- Columns whose header carries
.apply_search(PNR, Customer, Phone, From, To) get a text input filter. - Columns whose header carries
.apply_select(Type, Payment) get a Select2 dropdown populated from that column's unique values.
The generated fields land in #append_col, and Apply/Reset buttons are appended automatically.
The toolbar's filter button toggles the #show_multiple_filter_div panel open and closed.
Note: the panel's subtitle reads "Filter bookings by date range and type", but the demo source builds per-column search/select filters only — there is no date-range picker wired in the shipped page. Add one in the filter panel if your data needs it.
Toolbar and export/print
The toolbar is assembled by initToolbar and, for this page, contains an expand-all
button and the filter button. The DataTable layout (app.datatables.getDom()) provides
the page-length selector, the global search box, the record-count info and pagination —
but no built-in CSV / Excel / PDF / Print buttons. If you need export or print, add the
DataTables Buttons extension and register the buttons in getDom() (see
Tables).
Data source
The table is populated over AJAX from the report endpoint, resolved through the shared API contract:
ajax: {
  url: API_CONFIG.getUrl(API_CONFIG.endpoints.BookingReport.getBookingReport),
  dataSrc: "data"
}To point the report at your own backend, change that endpoint in API_CONFIG (and its mirror
in packages/design-system/api-contract.mjs); the column bindings stay the same as long as
your JSON keeps the field names above.
All reports
Every report page in the product, and where it is documented:
| Report page | What it covers | Documented in |
|---|---|---|
bookingReport | Booking / revenue ledger with per-column filters and expandable trip detail | This page |
customersReport | Customer activity and CRM reporting | Customers & CRM |
attendanceReport | Driver attendance | Drivers & Attendance |
vehicleStatistics | Per-vehicle statistics | Fleet & Vehicles |
vehicleSummary | Vehicle summary report | Fleet & Vehicles |
vehicleConsolidate | Consolidated fleet report | Fleet & Vehicles |
dispatcherWise | Dispatcher-wise trip breakdown | Trips & Dispatch |
All of these are built on the same filter-panel + DataTable + toolbar pattern described above, so the column/renderer/filter conventions carry across. For the underlying table mechanics (initialization, search, paging, expandable rows and how to add export buttons) see Tables.
Was this page helpful?