Dashboard
The Taxi CRM 2026 operations dashboard — KPIs, schedule, live bookings, fleet status and analytics — and the two layout variants that ship.
2 min read
Updated June 20, 2026
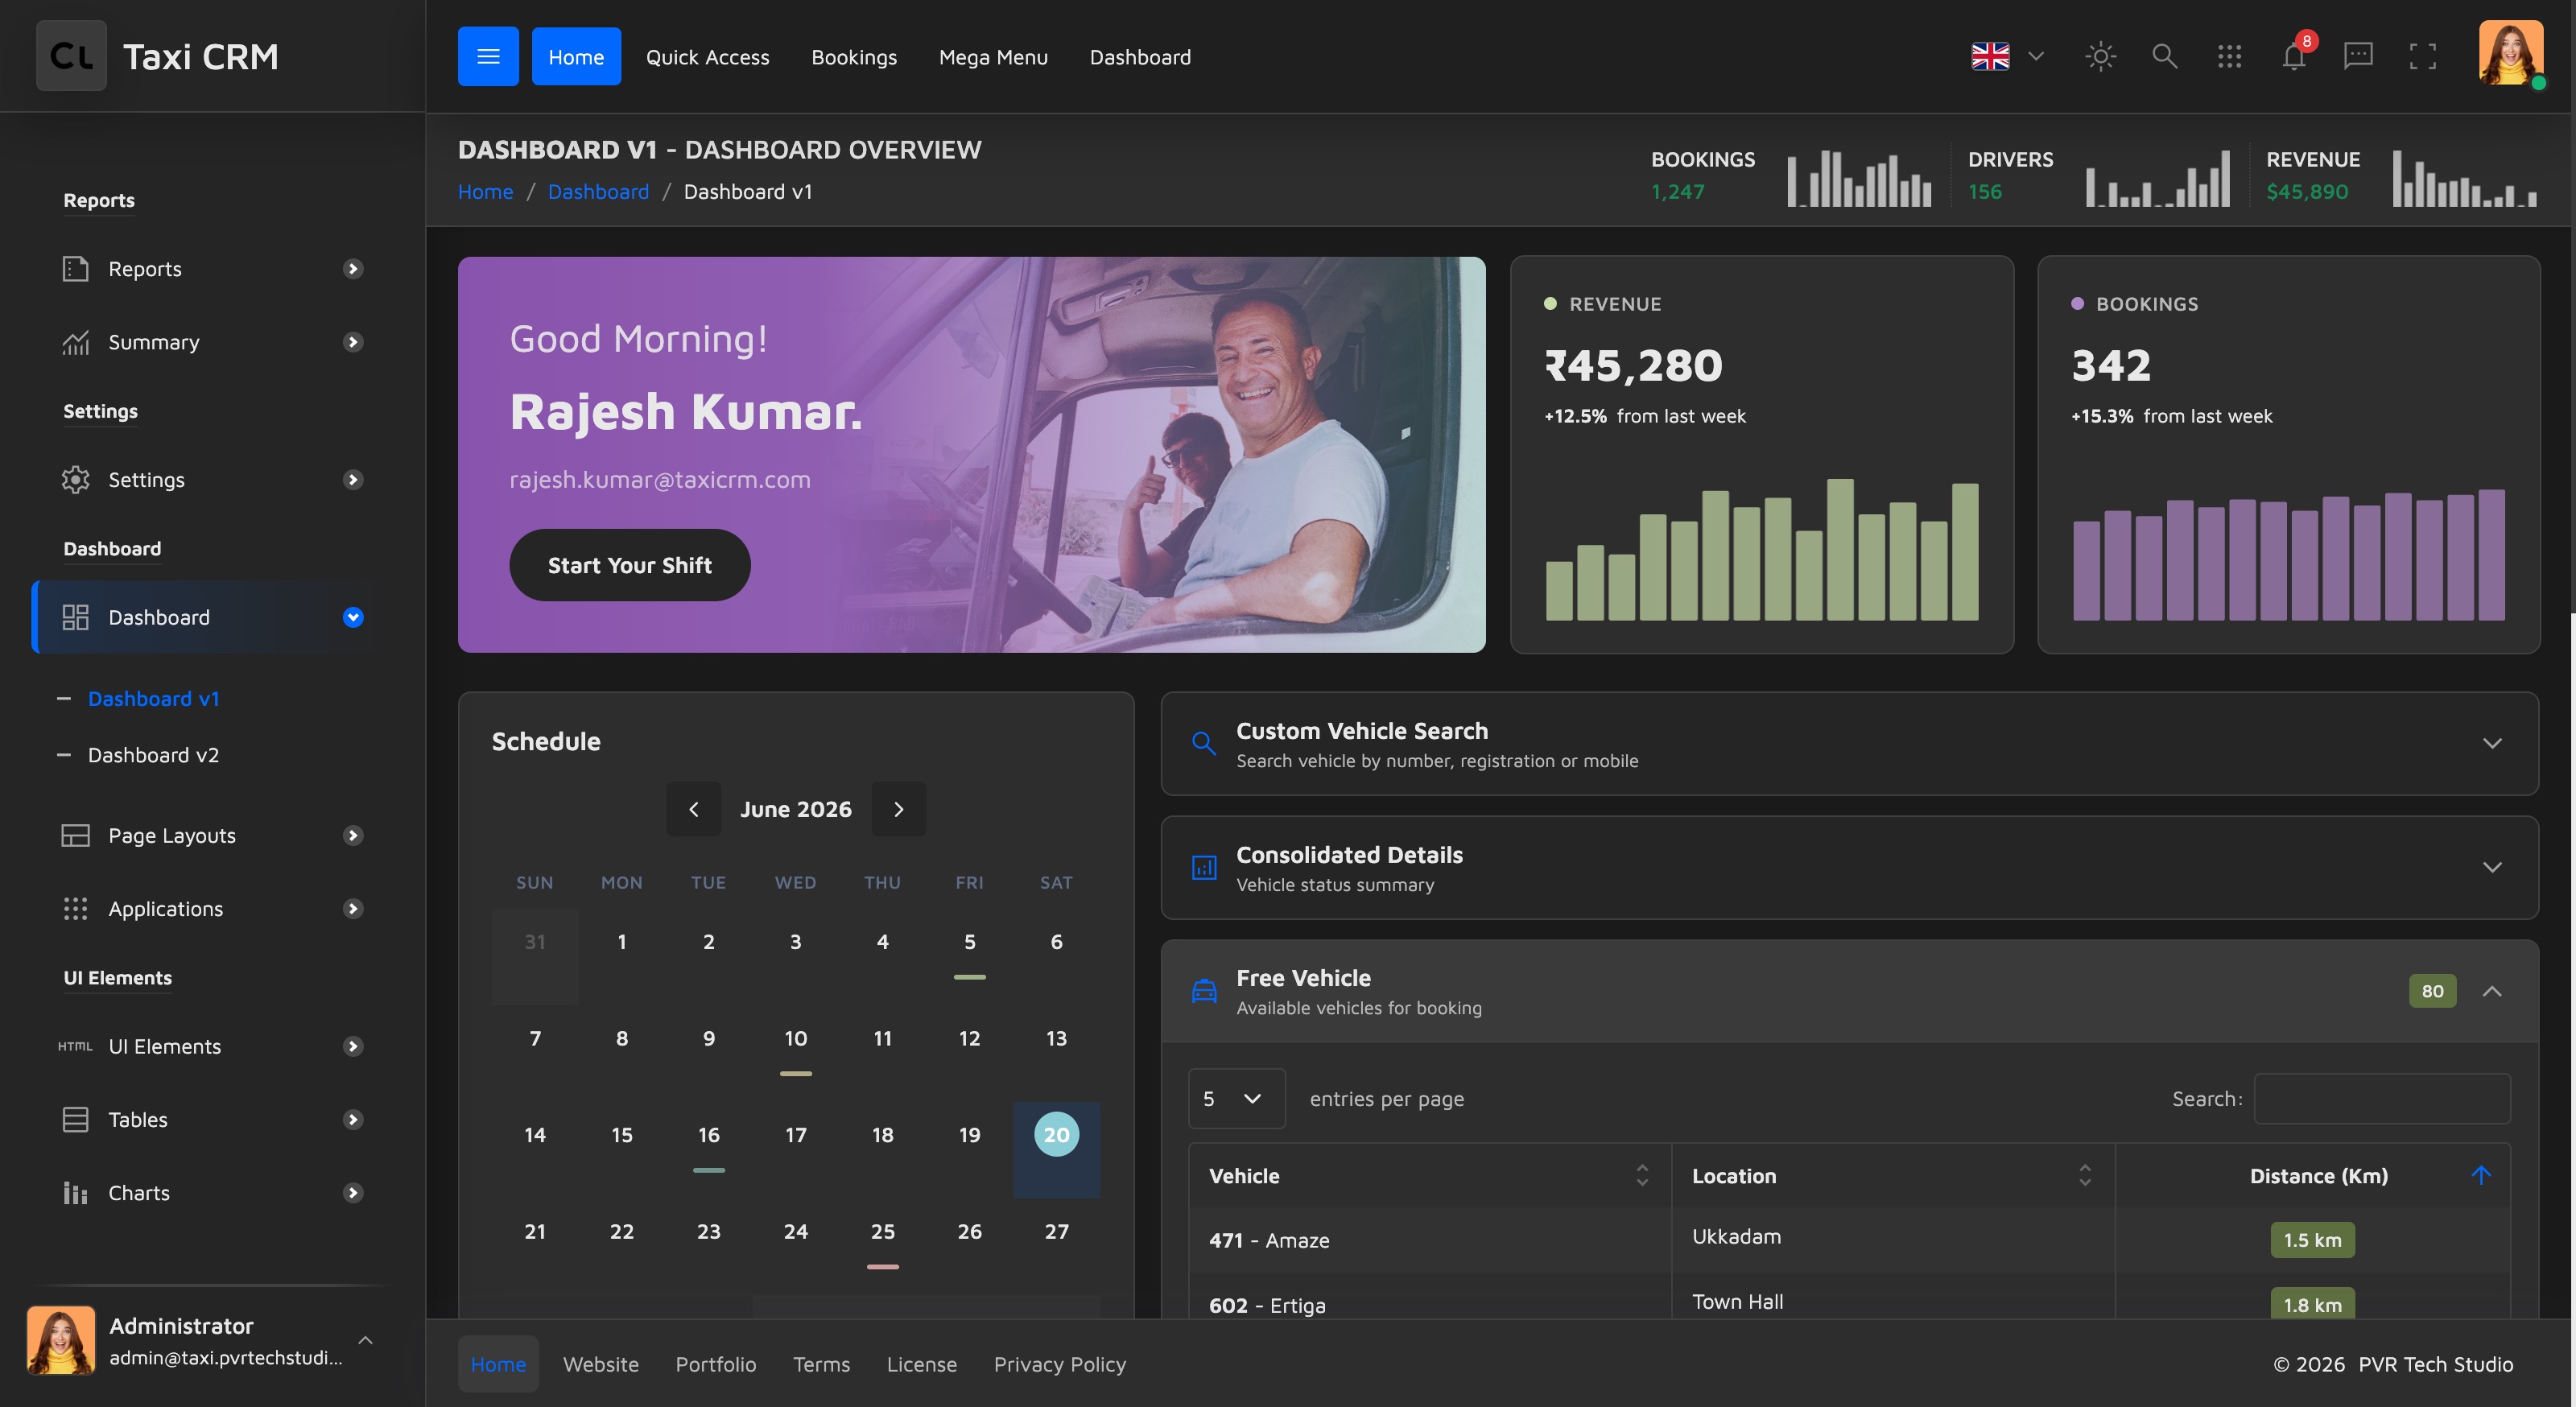
The Dashboard is the operator's home screen — a single view of bookings, drivers, revenue and fleet health. Two variants ship with the kit:
- Dashboard v1 —
index.html(the default landing page) - Dashboard v2 —
dashboardV2.html(an alternate layout)
↗ Dashboard v1 live demo · Dashboard v2 live demo
What's on the dashboard
| Section | What it shows |
|---|---|
| KPI header | Headline counters — Bookings, Drivers, Revenue |
| Welcome card | Greeting, signed-in user and a Start Your Shift action |
| Revenue / Bookings cards | This-week totals with a week-over-week delta |
| Schedule | Month calendar with booking events |
| Upcoming Events | Next pickups and transfers with status badges |
| Today's Timeline | Chronological feed of assignments, pickups, cancellations and completions |
| Recent Bookings | Latest trips with customer, location and fare |
| Custom Vehicle Search | Collapsible search + a Free Vehicle DataTable (vehicle, location, distance) |
| Trip Analytics | Total / Completed / In-progress / Cancelled breakdown |
| Fleet Status | Total / Active / On-trip / Inactive vehicles |
| Top Drivers | Leaderboard by trips with ratings |
| Active Customers | Most active customers by trip count |
Building from the dashboard
The dashboard is assembled entirely from widgets arranged with rows and columns. To build your own variant:
- Start from
index.html(v1) ordashboardV2.html(v2). - Remove the widget cards you don't need — each is an independent
.card. - Add widgets from
widgets.htmlfor the metrics you do need. - Wire the counters, tables and charts to your data (the demo uses the mock API and Highcharts — see JavaScript Helpers and Charts).
All labels on the dashboard are translatable via
data-i18nattributes — see Internationalization.
Was this page helpful?